A quick look into Anonymised
This page gives you a high-level overview of some key features of the Anonymised platform. Short introductory videos will show you:
How to measure your deals more efficiently from a single platform
How Anonymised collects and processes the data on the device
There’s a lot more that Anonymised can do, from custom integrations with your CRM data through meta-curation of your campaigns to segment-based attribution. For a comprehensive demonstration, please Book a demo or contact support
1. Audience targeting
One of Anonymised’s core functionalities is the ability to target audiences across all browsers and devices using real-time data. With the addition of Aura AI, Anonymised's agent, you can now build audiences in three ways:
You can share your campaign background and objectives, and ask Aura AI to suggest the best audience for that campaign
You can share the audience description and ask Aura AI to build the audience for you
You can build your audience manually by selecting the relevant locations, devices, demographics, interest categories, topics and engagement level
You can also ask Aura AI to enlarge, refine or change the audience - but also to manage your active campaigns, provide information about Anonymised and much more.
https://youtu.be/JsZ9aMkp7DwAnonymised Audience Creation
2. Custom Audiences
If you want to build audiences using your first-party website data, use Anonymised retargeting function. This allows you to build audience lists using custom parameters you want, such as:
Visit to specific URLs or to pages with certain values in their data layer
Page events, such as clicks on certain UI elements
Ad events, such as ad views and ad clicks
By combining these custom parameters, you can build audiences that perform intent-based actions such as adding a specific product to the cart or browsing selected product categories. You can also build audiences of people who have already been exposed to, or have previously interacted with, a campaign.
https://youtu.be/EyANL9CHoC4Anonymised Custom Audiences
3. Audience Intelligence
Integrating the Anonymised tag on your page gives you out-of-the-box access to granular audience analytics. The data shows you the behaviour of your audience on your site (or your network of sites) as well as their behaviour over 1,500 domains that use Anonymised, and growing.
By default, you will be able to view aggregate data on audience interests, engagement levels, consumption patterns, frequency of visits, and peak activity.
If you are a publisher network, you can see off-site, non-endemic interests, monitor how your audience moves across domains and use custom categories to identify the most valuable segments.
If you are an advertiser, you can use these insights to build lookalike models or inform your next campaign planning.
Unlike a typical analytics product, Anonymised’s Audience Intelligence feature displays fully addressable audiences. You discover your target audience, build it and activate it from the same place with just a few clicks.
https://youtu.be/Mknbm0gwN7UAudience Audience Intelligence
4. Deal Management
Once you build your audience, you can also build and manage your curated deals directly from your Anonymised platform. Through our connection with all major curation platforms and ad servers, Anonymised lets you:
Automatically send audiences to your supply-side technology
Monitor all active deals from one single interface
Optimise performance and troubleshoot the deals
Aura AI will be continuously monitoring active deals for you and notifying you of any discrepancies against your campaign goal. With Anonymised’s Deal Management, you will not need to log into 10 different SSPs and monitor deal performance: your assistant will do this for you, saving you time and helping you make fewer mistakes.
Moreover, Aura AI will give you access to Anonymised’s experience, troubleshooting and optimising deals, knowledge that we’re continuing to build by managing hundreds of curated campaigns. You will have access to a growing body of up-to-date operational knowledge and an expert team ready to support you.
NB: A video of the campaign management feature will be uploaded soon
5. Campaign Measurement
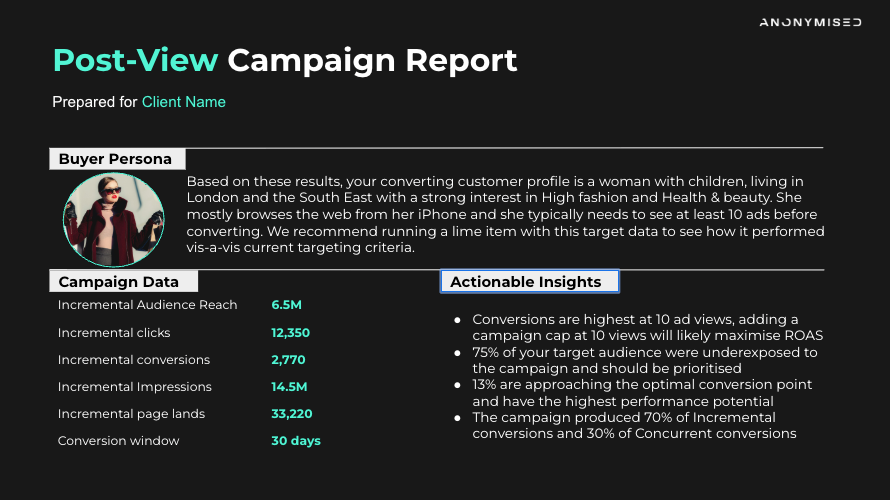
Finally, Anonymised empowers you to see the result of your campaigns and optimise spend accordingly. We strongly recommend using Anonymised’s Campaign Measurement alongside your DSP and ad-server measurement to get a fuller picture of the true performance of your ID-less campaigns. This is because DSPs and ad servers can only measure post-view conversions for impressions that have a cookie or an ID. You are, therefore, by default, missing all post-view conversions on ID-less traffic (largely on Safari and iOS) and only measuring post-click conversions.
Anonymised plugs this gap in two ways:
By giving you segment-based attribution metrics, combining post-click and post-view metrics
By automating incrementality tests that measure the correlation between campaign exposure and conversions
Anonymised is working with independent verification partners to open up its technology and methodology to the market.
Segment-based Attribution:

Anonymised Attribution Mock Template [double click to preview]
Incrementality Testing:
https://youtu.be/yKc5O4Jc4JMAnonymised Geo-based Incrementality
6. Data Processing
Anonymised collects data across a variety of channels, but one common aspect of our technology is that it is able to link data from different sources and process it on the consumer device for added privacy, speed and reach.
In this video, you can see Anonymised’s default cross-site processing on Safari. Raw data is collected, processed and deleted in real time to produce detailed user profiles. These profiles are assigned to an audience in real time directly on the user device, without leaking personal data.
https://youtu.be/yxZy7Yi1wT4Anonymised Data Account
